Overview—Most business dashboards are a wall of charts that each answer their own question. Numbers on one panel disagree with the next, colors repaint when a filter changes, and the exact value lives only in a tooltip. This dashboard treats the page as one analysis. A single set of filters (date range, region, channel and category) drives every tile, chart and table, so the numbers always agree. Clicking a bar, legend entry or table row drills into it. Above the charts, an insights panel says in plain language what drove the change, and the revenue chart forecasts the coming weeks and marks unusual days. The filter state lives in the URL, so any view can be shared as a link. It runs on built-in sample data or on a CSV you upload, which never leaves the browser. Every chart can be switched to a table, and the color palette is validated for color-vision deficiency in both light and dark mode.
IThe Problem
A sales lead wants to know why revenue moved, an operations manager wants to know which fulfillment center is slipping, and both want to see it for one region without rebuilding the report. Typical dashboards make that hard. Each chart has its own filter, so after two clicks the panels describe different slices of the business. Series colors are assigned by rank, so filtering repaints them and the reader's mental map breaks. Values that matter are reachable only by hovering.
This project starts from one rule: the dashboard is a single question asked of a single slice of data. Everything on the page is computed from the same filtered facts, and every interaction changes that slice rather than one chart.
IIHow It Works
The app is a pure front end. Each stage is a small, typed module, and the views never compute anything the aggregation layer didn't produce.
- Fact tableTwo years of daily facts at the grain of day × region × channel × category: orders, revenue, new and returning customers, on-time deliveries, fulfillment hours and returns.
- FiltersDate range, comparison (previous period or same weeks last year), region, channel and category. They are mirrored in the URL query string, so a view can be bookmarked or shared.
- AggregationTotals, the comparison period, daily or weekly series, mixes, retention cohorts, a revenue forecast with anomalies, and the drivers of each change.
- ViewsKPI tiles and eleven charts and tables. Clicking a mark feeds back into the filters, so drill-down is just another filter change.
IIIWhat It Shows
The page opens on the headline number, revenue for the selected period, followed by six KPI tiles. Each tile shows its change against the comparison period, colored by whether the change is good for that metric. A drop in fulfillment time is green, for example. Below the tiles, an insights panel explains the change, and three sections answer the questions each team asks first.
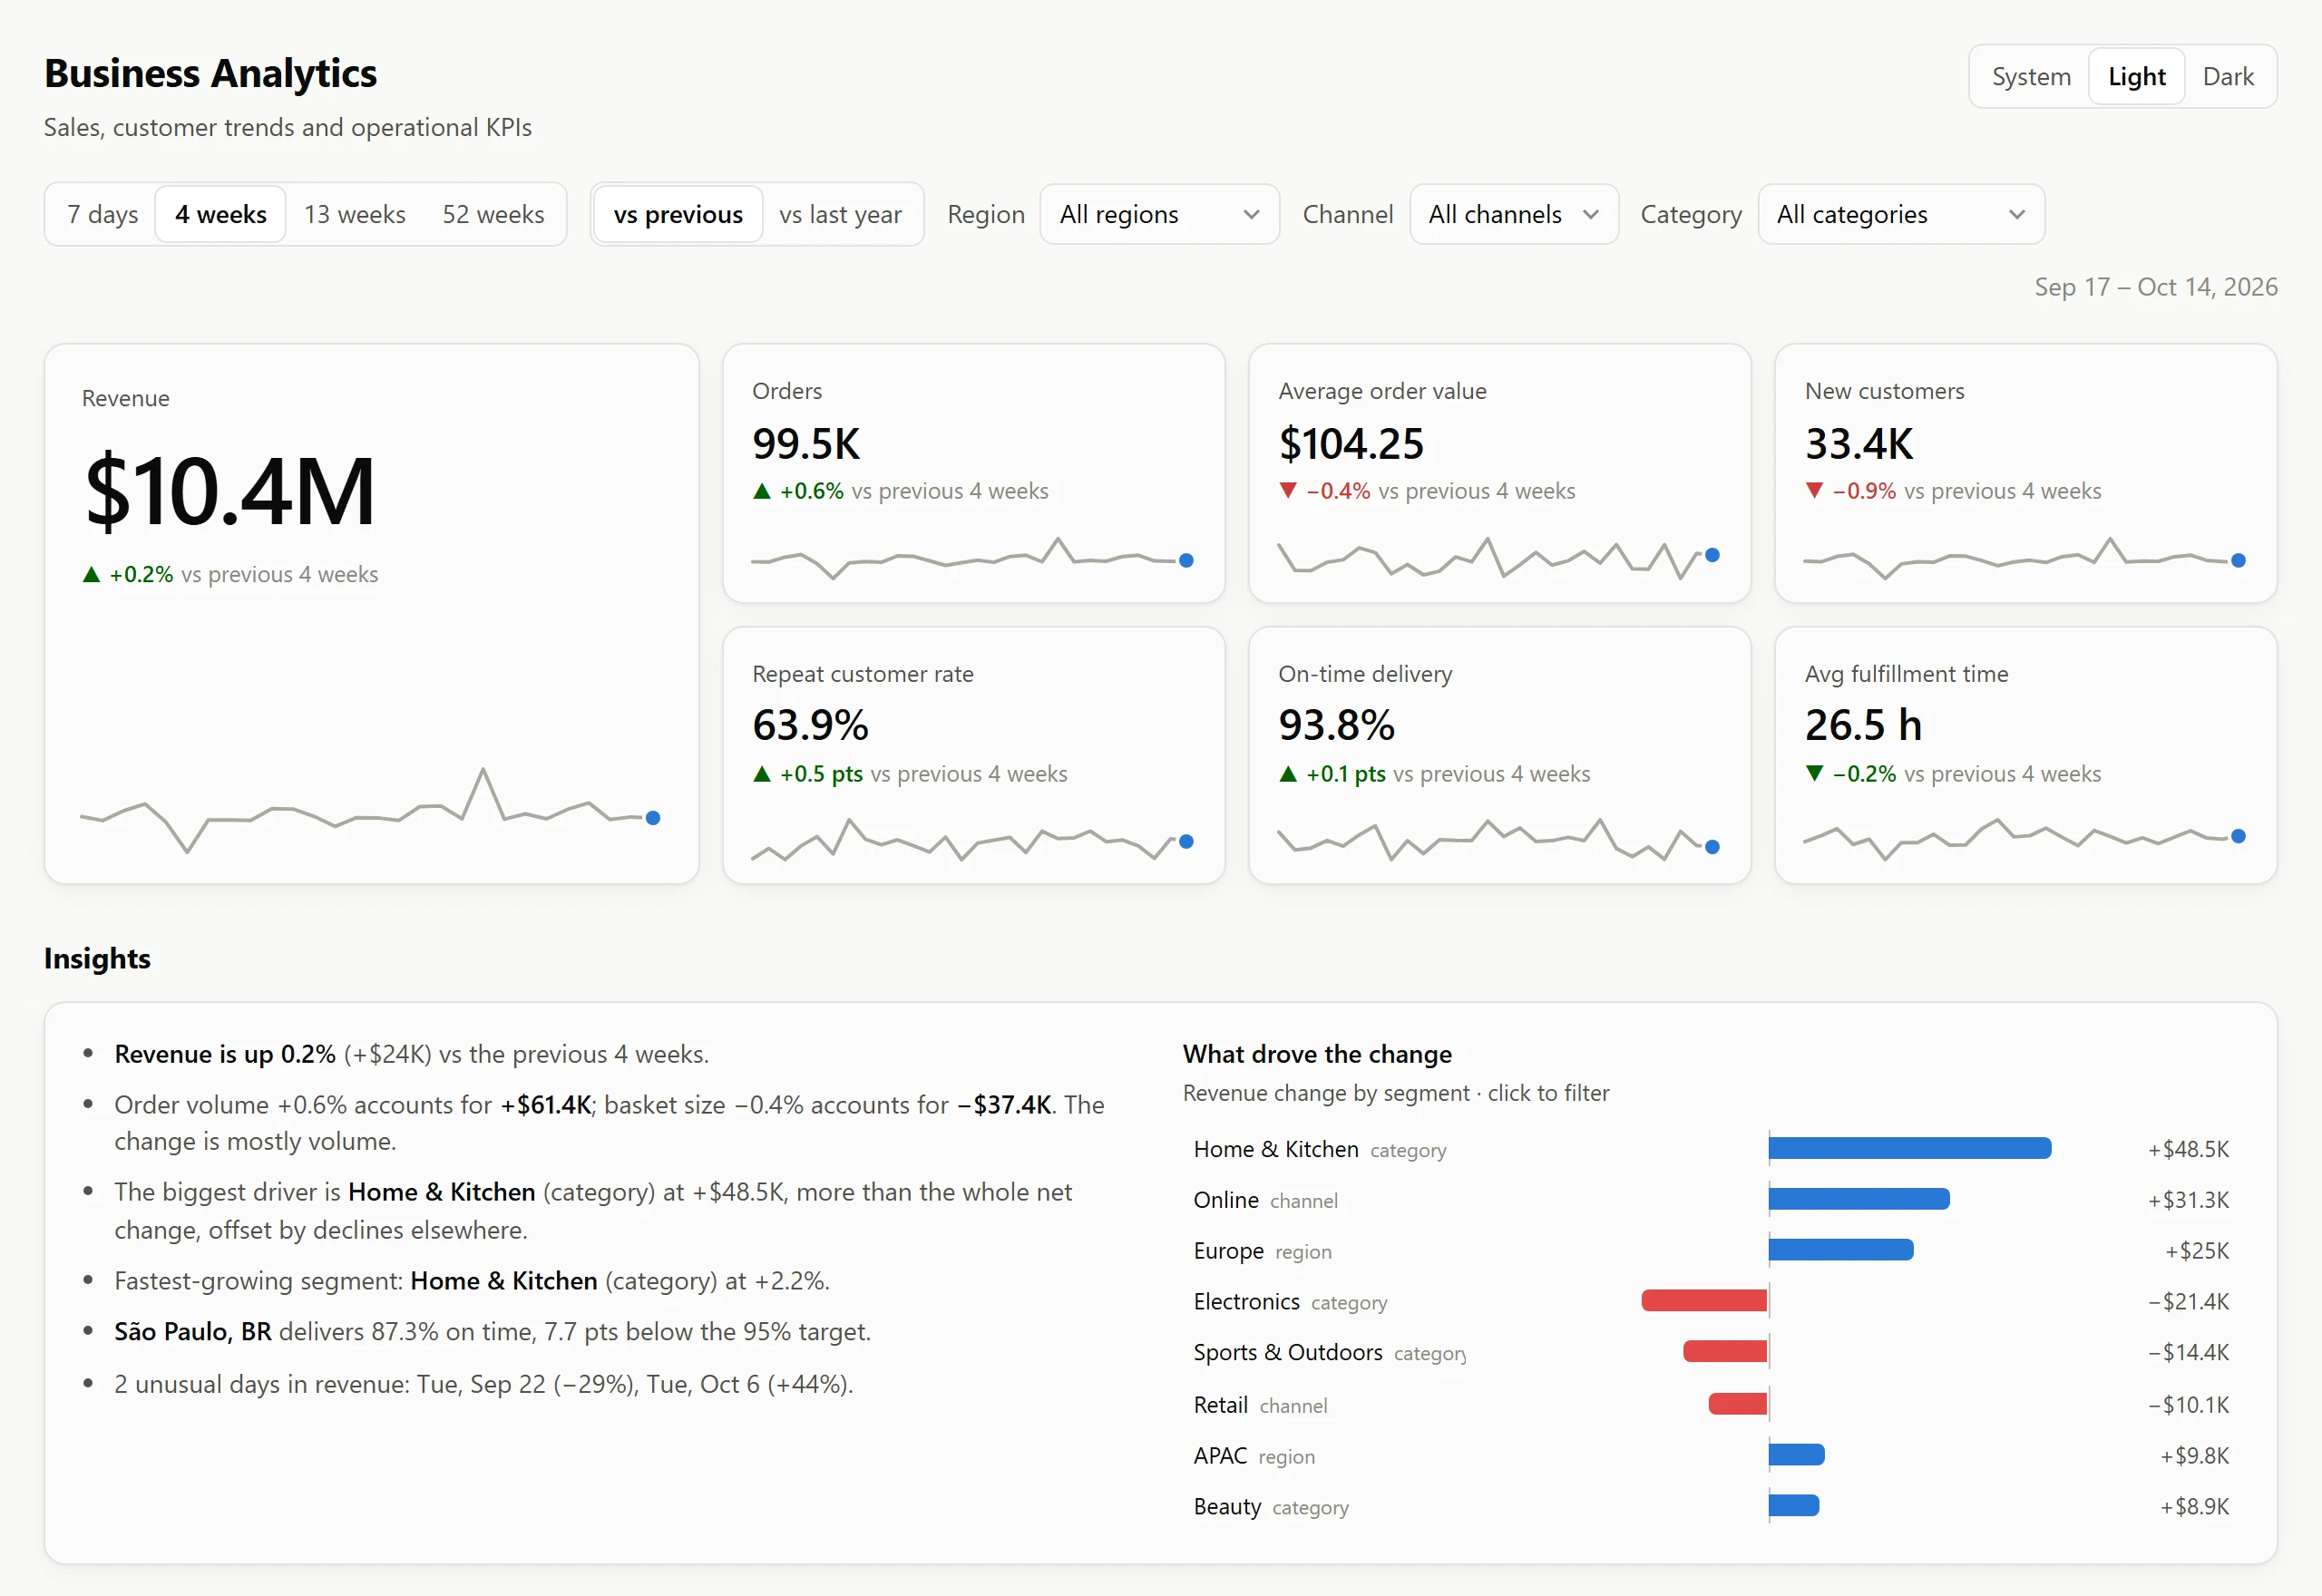
Table IThe eleven views and what clicking them does
| Section | View | Question it answers | Interaction |
|---|---|---|---|
| Sales | Revenue trend | Is revenue moving, and where is it heading? | crosshair · forecast |
| Sales | Revenue by category | Which product lines carry the business? | drill-down |
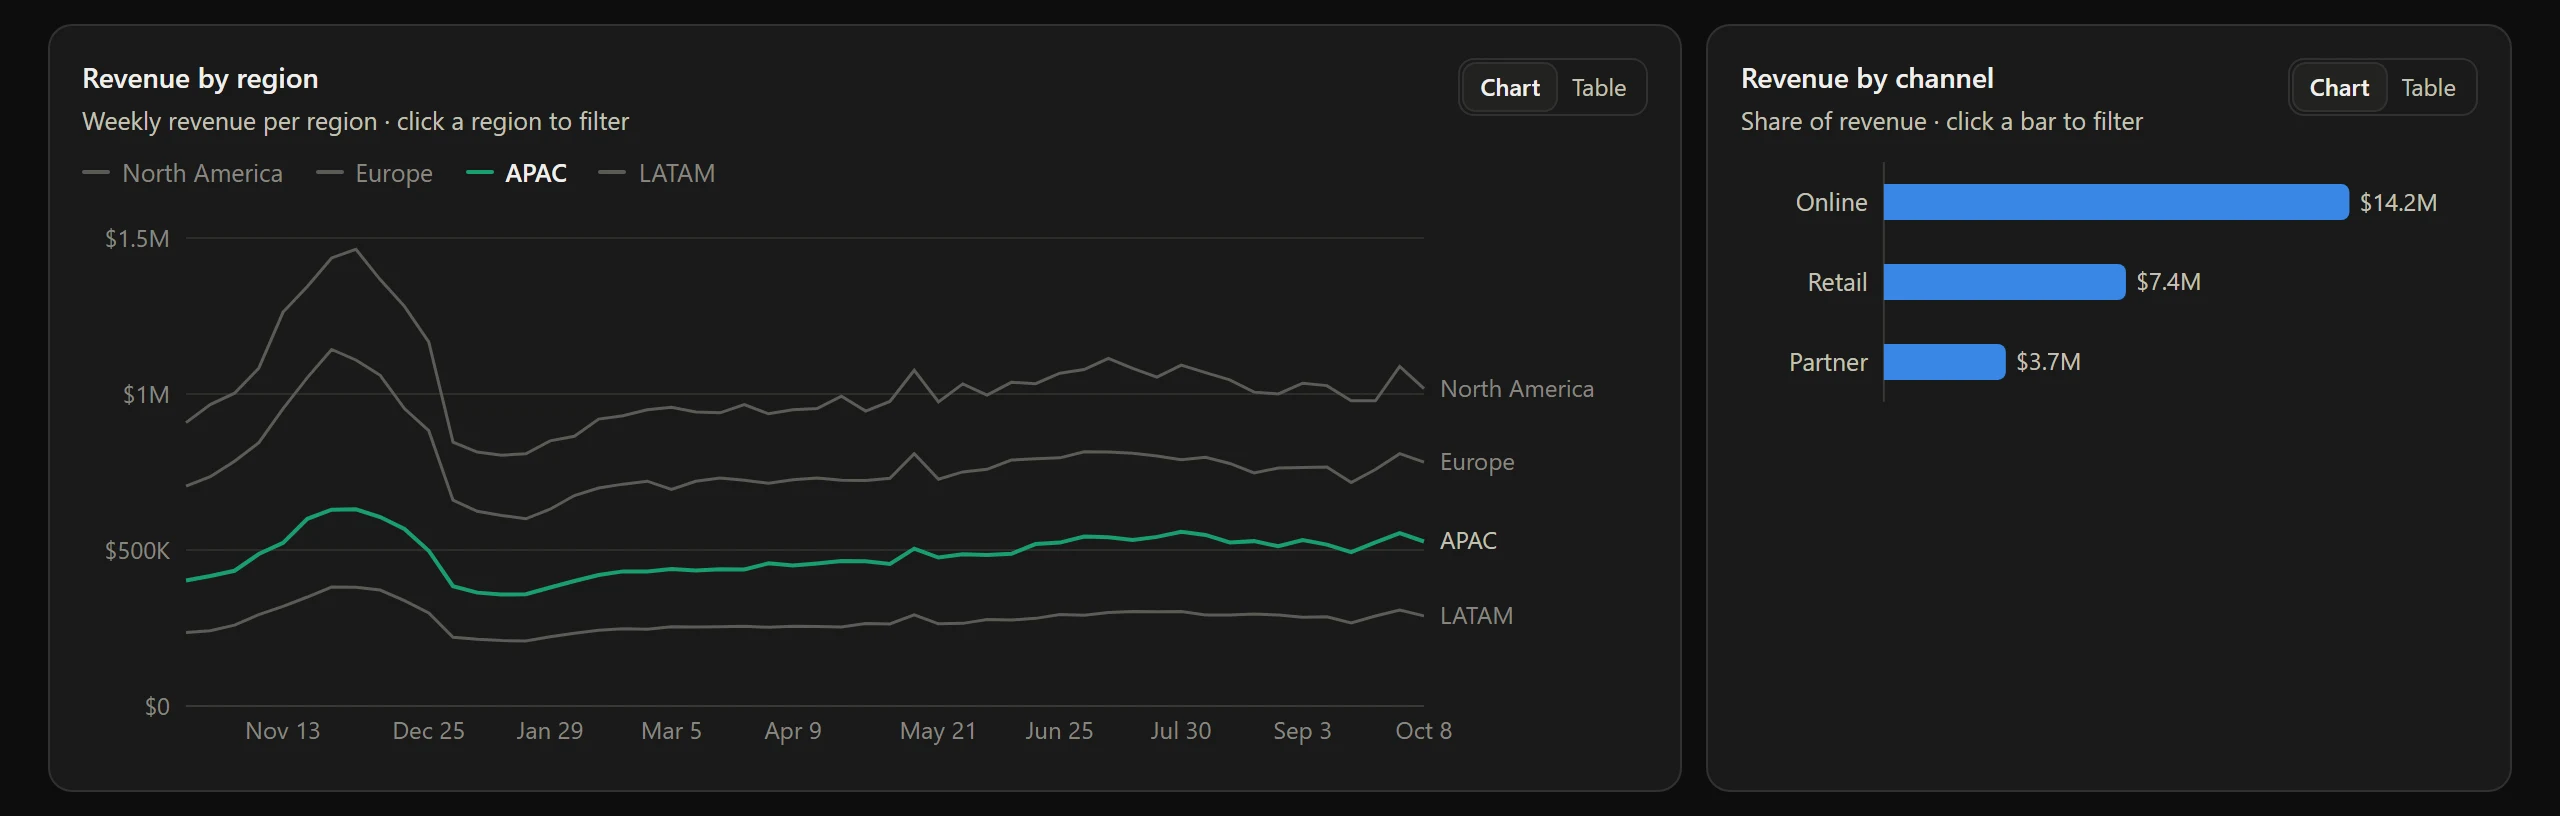
| Sales | Revenue by region | Where is growth coming from? | drill-down |
| Sales | Revenue by channel | Online, retail or partner? | drill-down |
| Customers | New vs returning | Are we acquiring or retaining? | per-bar tooltip |
| Customers | Repeat customer rate | Is loyalty improving? | crosshair |
| Customers | Retention cohorts | How many of each month's new customers come back? | per-cell tooltip |
| Operations | On-time delivery | Are we meeting the 95% target? | crosshair |
| Operations | Fulfillment time | How long from order to dispatch? | crosshair |
| Operations | Return rate by category | Which products come back? | drill-down |
| Operations | Fulfillment center health | Which center needs attention? | drill-down |
IVInsights & Forecasts
Charts show what happened. A team also needs to know why it happened, what comes next, and what looks wrong. Each answer comes from a small, explainable model rather than a black box, so every number can be traced back to the data.
- WhyRevenue change is split exactly into order volume and basket size, then attributed to every region, channel and category that the filters leave open.
- What's nextA seasonal forecast projects the next two weeks (or quarter of the range) with an 80% interval that widens with the horizon.
- What's wrongDays or weeks that break from the expected pattern are flagged on the chart and named in the insights panel.
Revenue bridge
A forecast that knows the calendar. Each future day is expected to look like the same weekday 52 weeks earlier, scaled by this period's year-over-year growth. That carries weekly rhythm and the holiday peak forward without fitting a curve, and it stays honest about uncertainty: the interval comes from how far actual days strayed from that expectation during the period.
Anomalies that respect the filters. A day is flagged only when its error is extreme by a robust z-score (median and MAD, so one outlier can't hide another) and at least 15% from expected. Because the model runs on the filtered slice, a local problem appears only where it happened.
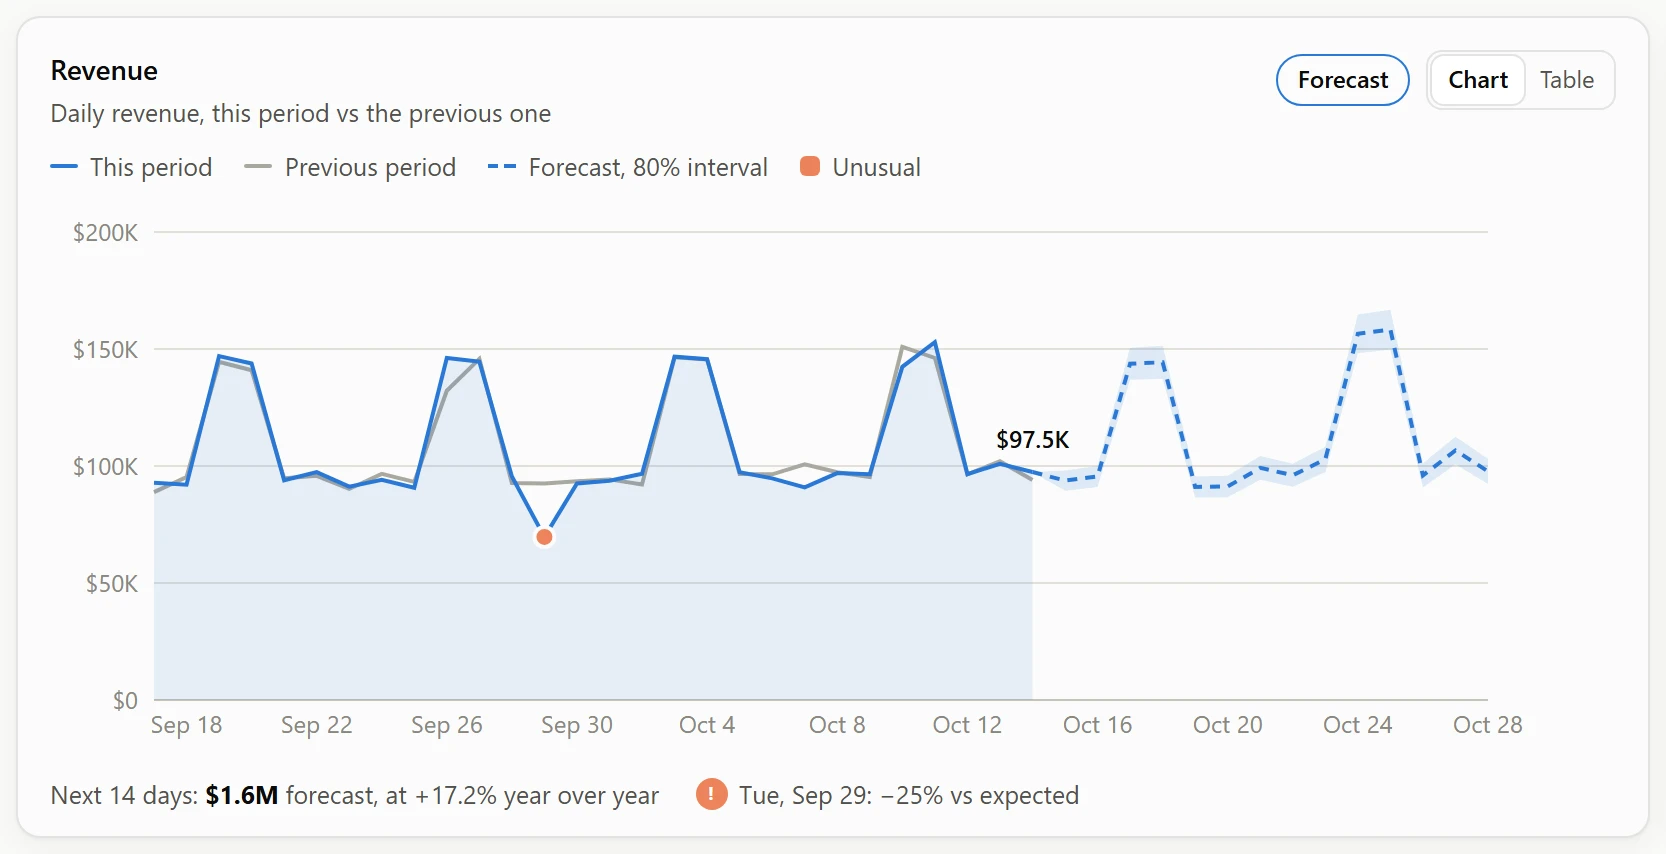
Table IIIWhat the anomaly detector finds in the last four weeks of sample data
| Event | Where it happened | All-up view | Drilled-in view |
|---|---|---|---|
| Flash sale | Online, all regions | flagged +44% | flagged +81% in Online |
| Checkout outage | Online, all regions | flagged −29% | flagged −57% in Online |
| Storm closes stores | Retail, North America | not flagged (−8%) | flagged −25% in Retail |
| Ordinary days | Everywhere | none flagged | none flagged |
VDesigned to Be Read
Color follows the entity, never its rank. North America is always blue and Europe always orange, whatever is filtered. A drill-down mutes the other entities to gray rather than repainting the survivors.
The palette is computed, not eyeballed. Adjacent series colors were run through a validator that simulates protanopia, deuteranopia and tritanopia and measures the color difference (ΔE in OKLab) between neighbors. Dark mode has its own validated steps of the same hues, not an automatic inversion.
Table IICategorical palette validation, four series
| Mode | Worst adjacent ΔE, CVD | Worst adjacent ΔE, normal vision | Contrast vs surface | Result |
|---|---|---|---|---|
| Light | 9.1 (≥ 8 target) | 22.9 (≥ 15) | Two hues below 3:1, so direct labels and table views are always provided | pass |
| Dark | 8.4 (≥ 8 target) | 19.8 (≥ 15) | All hues at or above 3:1 | pass |
Tooltips never gate
Every chart has a sortable Table view with CSV export, and lines carry a direct label at their latest value. Tooltips list every series at the hovered point, value first.
Status is never color alone
Fulfillment-center health pairs each status color with an icon and a label: On track, Watch, At risk or Critical.
One axis per chart
On-time rate and fulfillment hours are separate charts, never two scales on one plot. Axes snap to clean ticks such as 0, 1K, 2K.
Keyboard navigable
Every chart takes focus, and the arrow keys walk through the data with the same tooltip as the mouse. Drill-down works from buttons and table rows too.
Deltas know direction
Each KPI knows whether up is good. Rates change in percentage points and counts in percent, always against a named period.
Works on a phone
The grid collapses to one column without horizontal page scroll. Wide tables scroll within their own card.
VIEngineering
The dashboard runs entirely in the browser. Everything is derived from one typed fact table, which keeps it fast and easy to connect to a real source.
Deterministic data
A seeded generator produces 43,800 fact rows with growth, weekly and holiday seasonality, and peak-season strain on operations. The page looks the same on every load.
Bring your own data
Drop in a CSV and the dashboard adapts to its regions, channels and history. Columns are recognized or mapped, every row is validated, and the file never leaves the browser.
Fast at any scale
Each day is rolled into a cube of every filter combination, with prefix sums on top, so any filtered total is one subtraction. Cost no longer grows with the data.
Responsive while updating
Filters and KPIs update in under 60 ms. Charts render in a deferred pass and keep the previous view on screen, dimmed, so nothing flashes or jumps.
Tested
38 tests cover the data layer. The cube is checked against a raw row scan for all 120 filter combinations, and the bridge is checked to sum exactly. The tests also confirm the detector finds the seeded events and nothing else.
Continuous integration
GitHub Actions type-checks, tests and builds on every push and pull request, from a clean install.
VIITechnology
What's Next
- Live connectors for warehouses and e-commerce platforms, alongside CSV upload.
- Excel (.xlsx) upload.
- Alerts by email or chat when an anomaly is detected or a center drops below target.
- Saved views and scheduled digests for each team.
- Forecasts for orders and customers, not only revenue.
See it on your own business questions
The best way to judge a dashboard is on the questions you ask every week. I'm happy to walk you through a live demo.